Modeling physiological systems serves several purposes:
Prediction and Diagnosis: Physiological models can predict how the body will respond to changes in internal or external conditions, such as drug administration, exercise, or disease progression. This predictive capability is valuable for optimizing treatment strategies, designing interventions, and understanding the effects of different perturbations on the body.
Medical Device Development: Technology development relies heavily on the use of physiological models to design and refine devices intended for various medical applications. Engineers utilize these models to create and enhance the performance of medical implants, prosthetics, diagnostic tools, and therapeutic devices. For instance, in the development of cardiac implants like artificial heart valves, stents, and cardiac assist devices, these models are indispensable. Through simulations that replicate interactions with the body’s cardiovascular system, researchers can evaluate the safety, effectiveness, and durability of these devices, ensuring their suitability for clinical use before actual implementation.
Education and Training: Physiological models are used in medical education to teach students about the structure and function of the human body. By providing interactive simulations and visualizations, these models enhance learning and allow students to explore physiological concepts in a dynamic and engaging way.
What is the Pressure-Volume Cardiac Loop?

In the realm of cardiology, one of the fundamental concepts that researchers and clinicians often refer to is the pressure-volume cardiac loop. This concept serves as a graphical representation of the dynamic changes that occur within the heart throughout the cardiac cycle, providing valuable insights into its function and performance.
At its core, the pressure-volume cardiac loop illustrates the relationship between two essential variables: pressure and volume within the heart chambers. As the heart contracts and relaxes during each heartbeat, these variables undergo significant fluctuations, which can be graphically depicted using a specialized plot known as the pressure-volume loop.
Components of the Cardiovascular Model
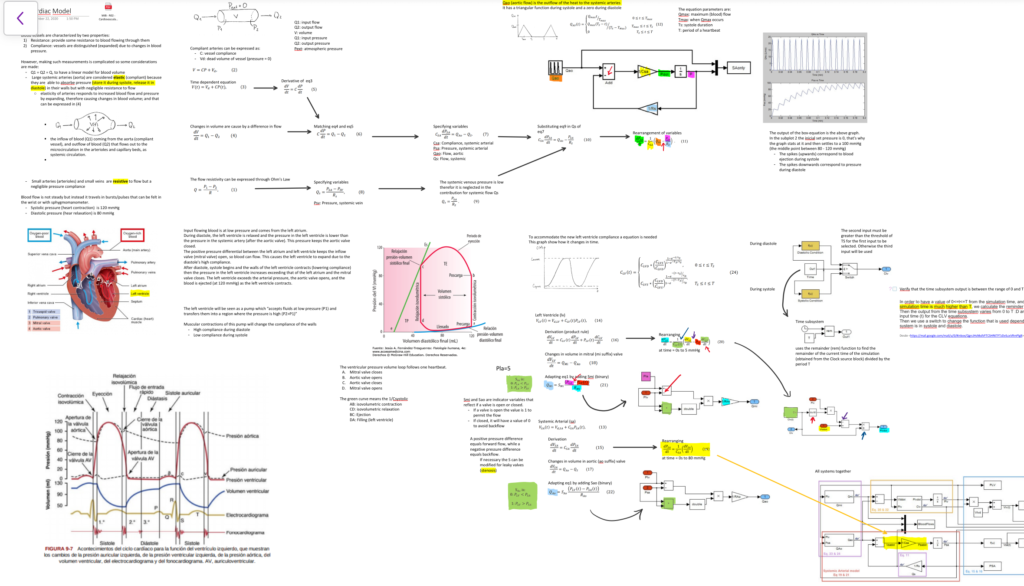
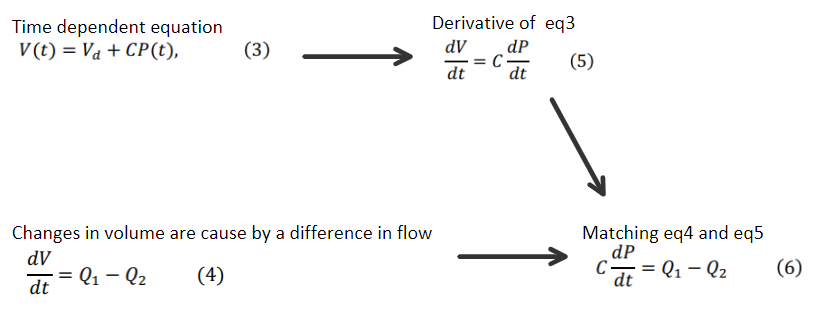
Prior to the construction of the model using Matlab, creating this mindmap explaining the components of the model was vital to the understanding. Key concepts to build this model include an understanding of compliance and resistive properties of vein and arteries, fluid dynamics, calculus, and control systems.
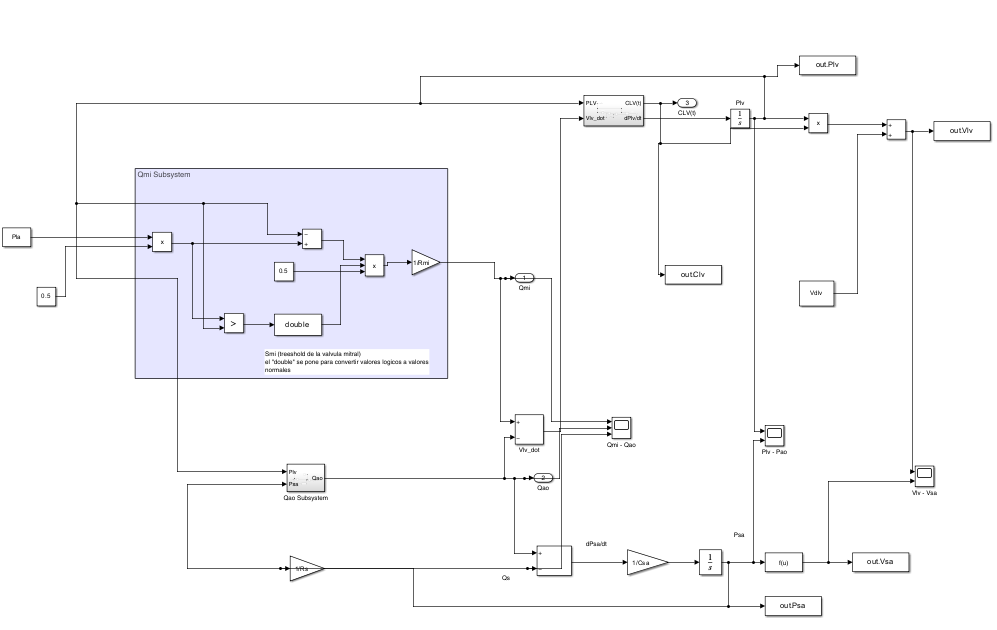
Once the equations were converted to small block systems, they were combined into a large system. Some subsystems were contracted into a single block to have a clean look.
Results and conclusions
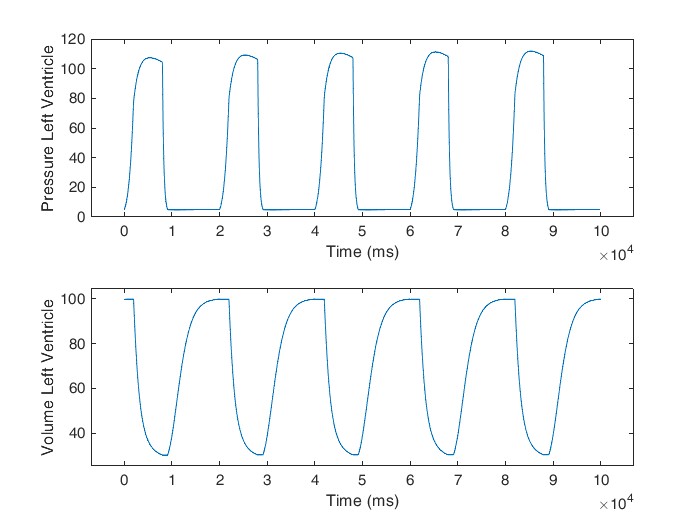
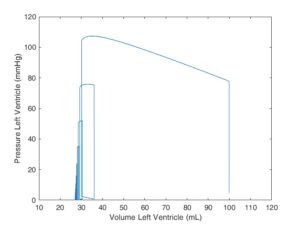
The model was constructed using MATLAB Simulink. Interest variable outputs were sent back to Matlab to be available to analyze the model. The variable out.Plv and out.Vlv stan for Pressure and Volume of the Left Ventricle, respectively.
Input-flowing blood is at low pressure and comes from the left atrium. During diastole, the left ventricle is relaxed and the pressure in the left ventricle is lower than the pressure in the systemic artery (after the aortic valve). This pressure keeps the aortic valve closed.
The positive pressure differential between the left atrium and left ventricle keeps the inflow valve (mitral valve) open, so blood can flow. This causes the left ventricle to expand due to the diastole’s high compliance.
After diastole, systole begins and the walls of the left ventricle contract (lowering compliance) then the pressure in the left ventricle increases exceeding that of the left atrium and the mitral valve closes. The left ventricle exceeds the arterial pressure, the aortic valve opens, and the blood is ejected (at 120 mmHg) as the left ventricle contracts.
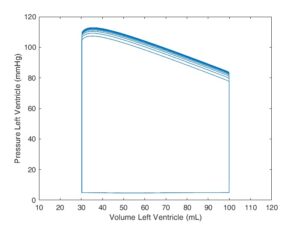
The Pressure-Volume Cardiac Loop is obtained by plotting Plv and Vlv against each other instead of time. Comparing it to the reference material at the beginning of the post confirms that the model works correctly.
Expanding the model to contemplate aortic stenosis implies pressure leak from the mitral valve and that when contracting it also flows back. Considering the physiological initial state we can obverse that the cardiac cycle still works however the volume of blood ejected to the body decreases exponentially.
This model was created by B.S. Manuel Alejandro Ramírez García . and Ph.D. Bradley P. Sutton. However, alterations expanding the scope of the model and didactic material used in this post were created by Agustin Nino




Leave a Reply